
market analysis - 10026 4th Ave SW
Prepared by Tara Farquhar of Lake & Company Real Estate
Key Market Factors Considered
Comparable Properties
Active Competition: Homes currently on the market that buyers are comparing to yours
Past Sales: Recently sold properties that establish price trends and buyer willingness
Supply of Inventory: Indicates whether we’re in a buyer’s or seller’s market
Location
Zoning: Potential impact of land use, density, or development changes
Infrastructure: Accessibility, commute times, public transit, and utilities
Amenities: Proximity to parks, trails, shops, and services
Schools: Reputation and ratings influencing buyer demand
Timing
Seasonal Demand: Impact of listing during peak vs. slower market periods
Economic Variables: Local job market, inflation, and consumer confidence
Interest Rates: Affordability factor driving or cooling buyer activity
Property Condition
Overall maintenance and presentation
Updates, systems age, and aesthetic appeal
Functional layout, storage, light, and flow
Pros & cons summary (see below)
A Comparative Market Analysis (CMA) provides a snapshot of current market conditions if you were to list your home today.
The goal is to estimate a realistic market value range based on:
Recent closed sales
Current competition (active and pending listings)
Buyer demand for comparable homes
This is not an appraisal, and it’s not a prediction of the future. It’s a best-available estimate using current data.
Pricing a home is part data, part judgment, and part market psychology.
Market Snapshot: Current Conditions
Before diving into pricing, it’s important to understand the market environment your home will be entering.
Right now, the market is characterized by:
Inventory levels are low due to few listings coming on the market during the holidays. I expect more to come back on as the year progresses.
Average days on market in Seattle is around 25 days. However, within 2 miles from your home in your price range, days on market has ranged between 50 and 186 days. This depends on price, condition and specific location.
Buyers who are much more selective and have a lower sense of urgency than we have seen in past years.
What this means in practice:
Well-priced, well-prepared homes are still selling, but slowly
Homes that miss the mark on price or presentation tend to sit longer and require adjustments
Early momentum matters more than ever
Median Sales Price Graph
This graph shows that the median sales price has been trending downward for the season. Instead of the sharp annual increases we saw in prior years, prices are softening. This is a clear indicator that the market has leveled, and sellers no longer have the same leverage to push pricing above the comparable range.
Median Days on Market
This graph shows how long it is taking homes to sell. It is following the historic trend of homes that haven’t sold by the holidays tend to sit on the market and how much buyer activity is happening. This should adjust by February.
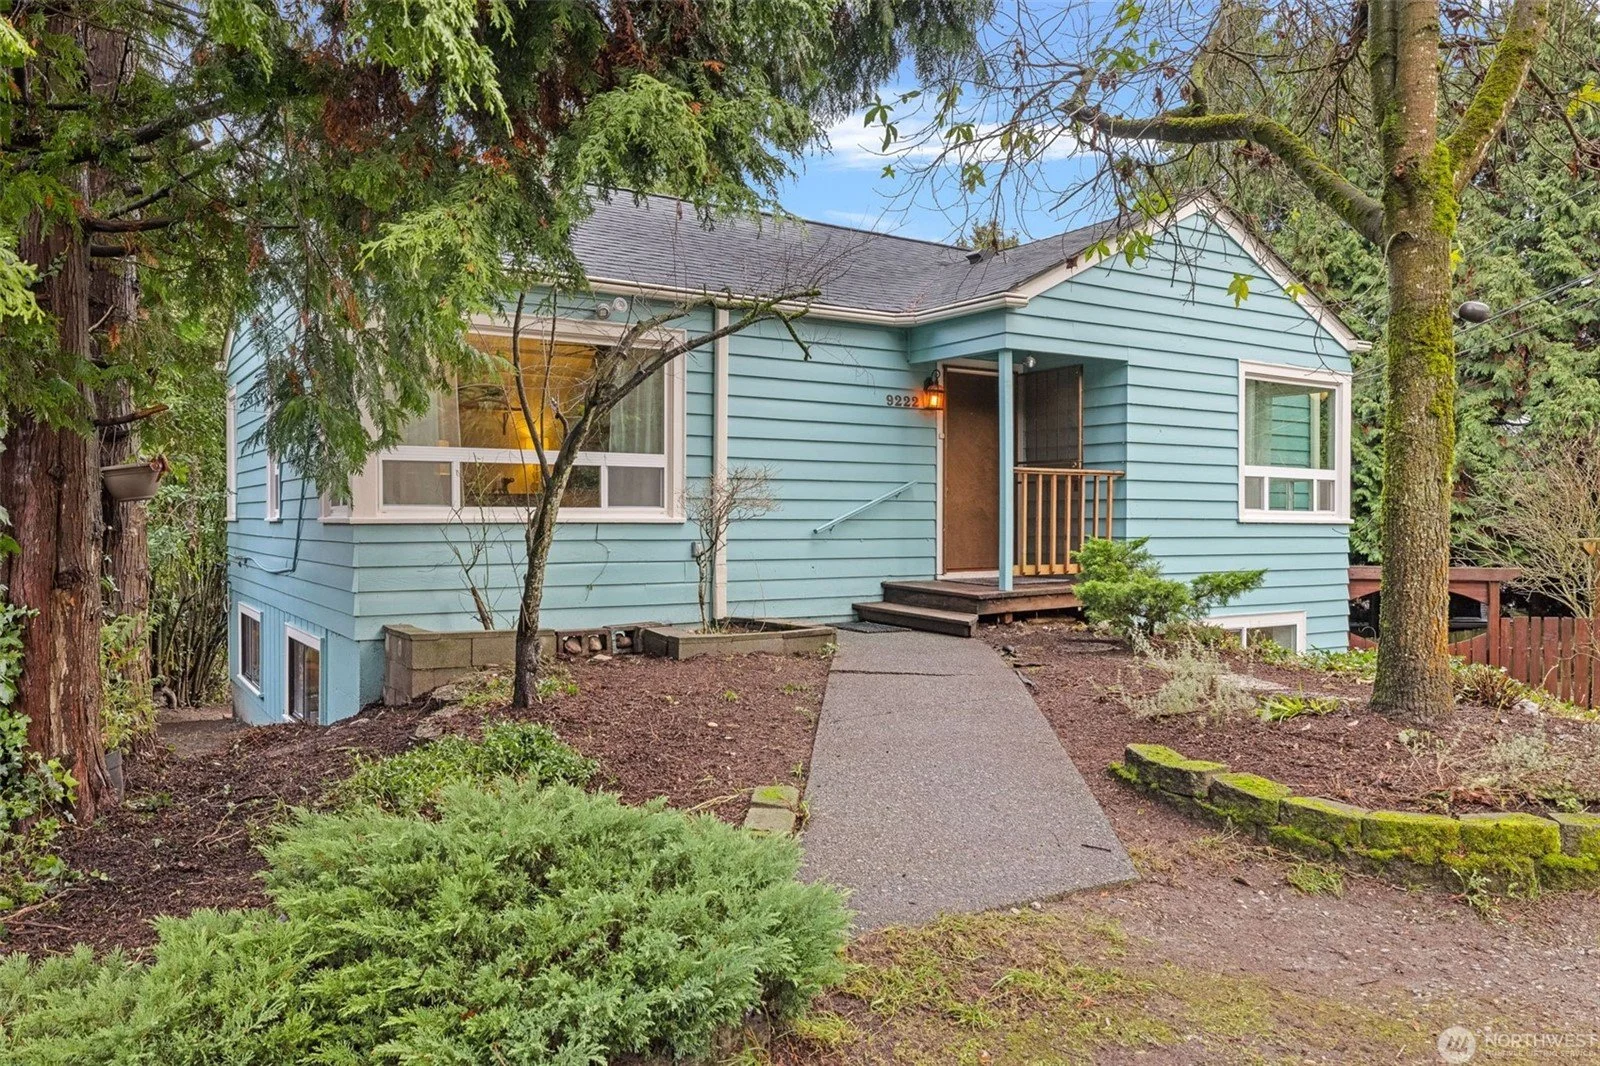
9222 3rd Ave SW
This is a home within your neighborhood listed at $699,000. It has been on the market for 10 days. What this home sales for will directly influence the list price of your home. I believe that it is priced significantly too high, but would love to be wrong. See the link below for more info on this home.
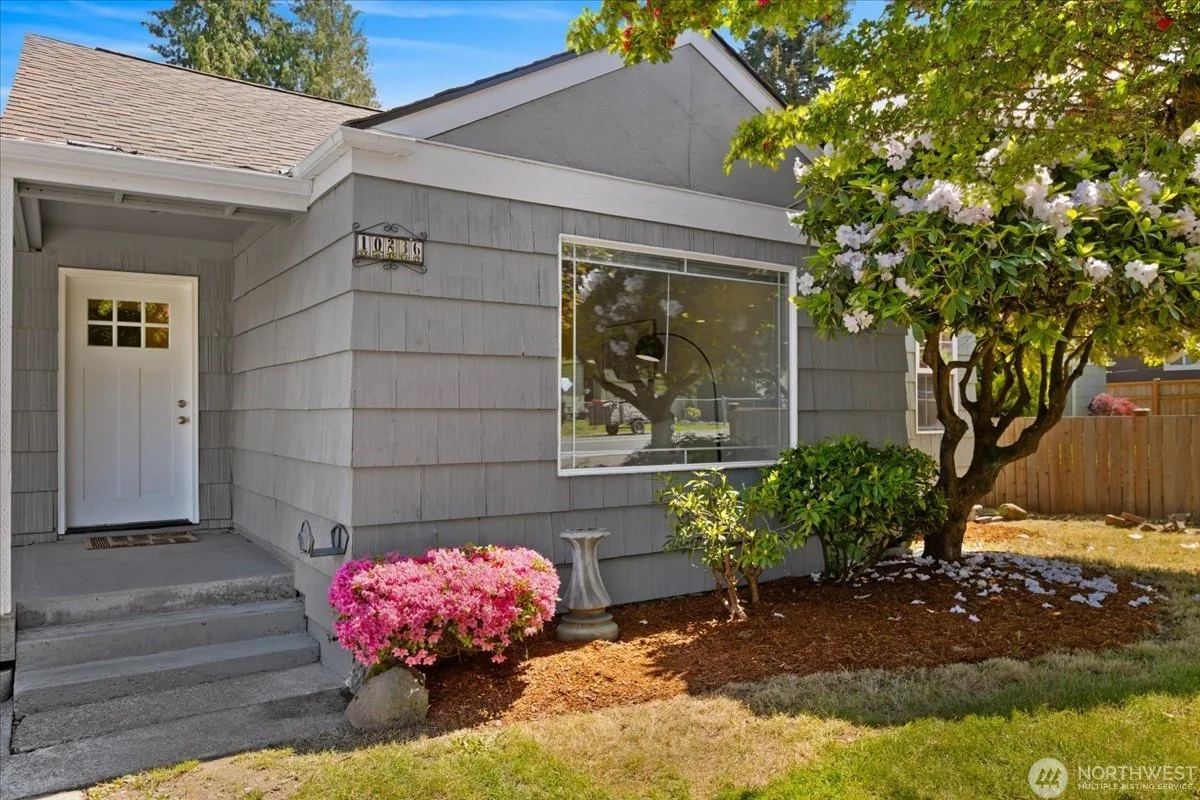
10236 1st Ave S
This home is nearby and in an insular neighborhood. All of the bedrooms are on the main floor and has a larger footpring. It took 85 days to get an offer and sold for $625,000.
COMPARATIVE MARKET ANALYSIS
Summary of Findings
Based on the comparable properties and overall market context, here are the key takeaways and recommendations:
Estimated Market Value $580,000 – $615,000
Within this range, we’ll choose a pricing strategy that aligns with your priorities:
Maximizing price
Minimizing time on market
Reducing uncertainty and stress
Other important findings
Developers do not appear to be investing in similar properties in the area at this time.
Based on the lot size and configuration, it appears an owner-occupant buyer will likely pay the highest and best price for this property rather than a developer.
I recommend completing an inspection sooner than later to confirm condition and identify any items that could affect valuation or marketability.
Estimated Net Proceeds
Within the links below, you will find your estimated net proceeds:
Click Here for $580,000
Net proceeds estimates are provided for planning purposes only and are not a guarantee of what you will receive at closing. Figures reflect common and projected escrow/title fees, excise tax, and comparable property real estate compensation trends. Several of these variables will be up to your marketing strategy. They do not include capital gains taxes or other individual tax liabilities.
Pricing Strategy & Terms
Recommended list price $599,000. Based on comparable properties and market conditions, this will most likely be the price to get you the quickest and cleanest sale.
Alternative Pricing Strategy starting at $615,000. We can start at this higher price point and plan on a price reduction strategy.
Homes that test the market or aim high are being passed over—even if they show well. And the longer a home sits, the more negotiating power shifts to the buyer.
Offer a competitive buyer broker compensation.
All but two of the comparable listings offered 2.5% buyer agent commission. To remain competitive in today’s climate, I strongly recommend offering the same.
Pre-inspection helps keep negotiations clean.
Buyers in this price range appreciate confidence and transparency. Having a pre-inspection gives you the best chance to avoid back-and-forth inspection negotiations after an offer and support a smoother closing.
Final pricing should reflect timing and competition.
We’ll monitor:
How the active comparable performs
What other listings are live when we go to market
This will help us fine-tune your price and position strategically in real time.
If at any point in time between now and the list date, we see significant market fluctuations or permit and zoning changes, we may advise you to list as-is immediately.

Sample social media post
MARKETING MIX
On-site showing directions
On-site amenities list
Professionally designed flyers and print materials
Custom listing website
Open house as needed
Informational text message to all scheduled showing agents with detailed showing instructions
Professional photography
Social media marketing blitz
Walkthrough video