market analysis - 11650 73rd Place NE, Kirkland
MARKET CONDITIONS - Median Home Prices & Months Supply of Inventory
The two graphs above illustrate why timing has a direct impact on both sales price and days on market.
Median Sales Price Graph
This graph shows that the median sales price has been trending downward. Instead of the sharp increases we saw in prior years, prices are softening. This is a clear indicator that the market is cooling, and sellers no longer have the same leverage to push pricing above the comparable range.
Months Supply vs. Pending Sales Graph
This graph shows inventory rising while pending sales are slowing. That shift means buyers now have more choices and can take their time before making an offer. In other words, we’ve moved firmly into a buyer’s market.
What this Means
Homes are taking longer to sell.
Buyers are negotiating more aggressively, asking for concessions, repairs, or price reductions.
Sellers need to price in line with the market and present their homes well to stand out.
Overpricing risks sitting on the market and ultimately netting less.
Together, these graphs confirm that we are in a declining market and a buyer’s market, where strategy and presentation are critical to securing a successful sale.
COMPARATIVE MARKET ANALYSIS
Market Analysis
Based on a broker market analysis, I would place the likely market value in the range of $1,550,000–$1,650,000. Net proceeds are within the email attachments.
Pricing Approaches
When we bring your home to market, there are three main pricing strategies to consider:
Price at Market Value ($1,550,000–$1,600,000):
This approach is aligned with comparable sales. It creates strong buyer interest and increases the chance of multiple offers if the home shows well.Price Aggressively High ($1,650,000+):
Testing the top of the range can work if the home is staged beautifully and stands out from the competition. The trade-off is that it may take longer to sell and risk price reductions if buyers don’t respond.Price to Drive Competition ($1,500,000–$1,525,000):
Coming on below market value can attract more buyers, create urgency, and potentially drive the price up through multiple offers. This strategy works best in strong seller’s markets, but can still be effective if we want to ensure activity quickly.
Comparable Properties
These recent sales and current competition help us see how buyers are currently responding to similar homes in your area.
Click Here > https://portal.onehome.com/en-US/share/1439987O83333
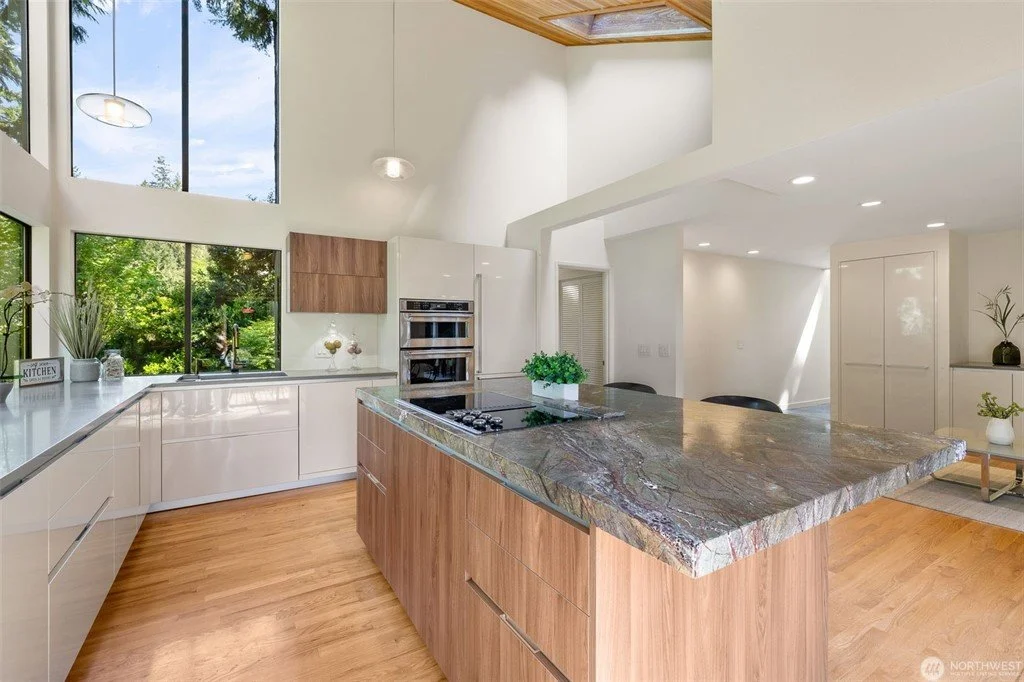
11819 73rd Place NE Kirkland - Most similar comparable
Listed at $1,799,000 Sold at $1,725,000
102 Days on the Market
High end kitchen remodel
Larger floorplan and true 4th bedroom
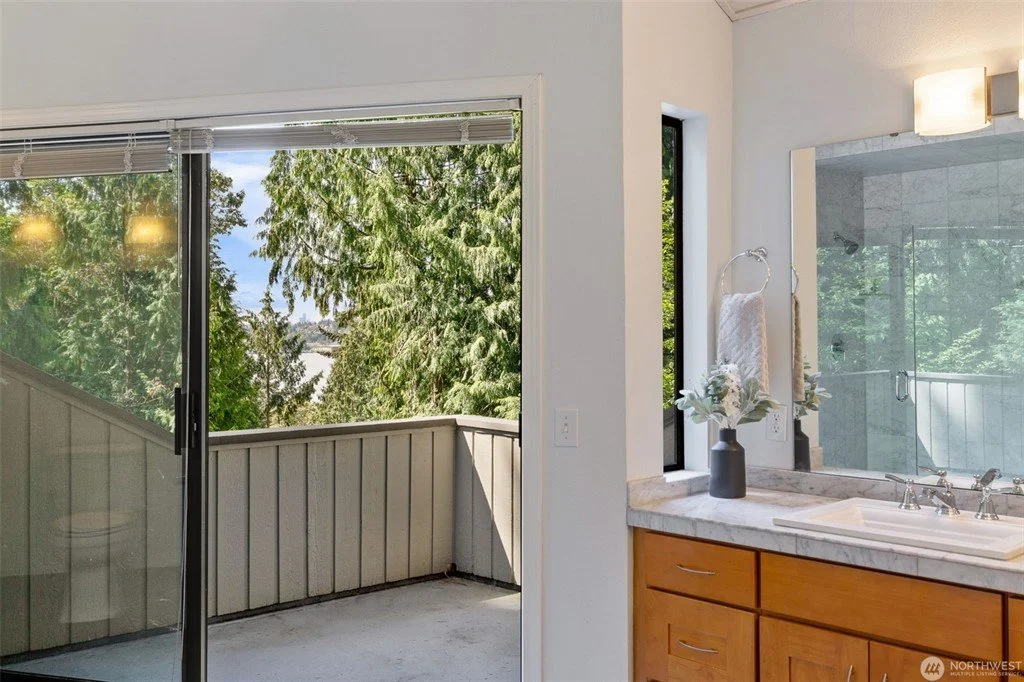
Peekaboo water view & More light
Similar level of additional updates
Traditional Yard but smaller lot size
Located at the end of a quiet street in Holmes Point
Key Considerations
I haven’t yet been inside the property, so the final price strategy depends on:
Condition & Layout: The finishes, updates, and floor plan functionality.
Presentation: Vacant homes that are staged typically perform better.
Repairs: Having no major repairs outstanding—and providing a seller-procured inspection—helps create buyer confidence.
Timing: Market activity shifts seasonally and even week to week.
Buyer Broker Compensation: This assumes the seller is willing to offer compensation, which remains an important driver of showings and offers.
Net proceeds estimates are provided for planning purposes only and are not a guarantee of what you will receive at closing. Figures reflect common and projected escrow/title fees, excise tax, and comparable property real estate compensation trends. They do not include capital gains taxes or other individual tax liabilities.
Focus updates where they matter most.
Paint, updated lighting, and thoughtful staging will have the biggest visual impact. These elements improve brightness and create emotional appeal that photos and buyers respond to—especially in a home with limited natural light or carpet.
Staging costs add up—time matters.
Staging is a monthly rental, so the longer we’re on market, the more it costs. Proper pricing not only drives faster interest but keeps your total carrying costs down.
Next Steps
Once I’ve had access to the property to confirm the condition and layout, I can refine this analysis, firm up net proceeds, and recommend a clear pricing and marketing strategy.
Final pricing should reflect timing and competition.
We’ll monitor:
How the active comparable performs
What other listings are live when we go to market
This will help us fine-tune your price and position strategically in real time.
Sample social media post
MARKETING MIX
On-site showing directions
On-site amenities list and link to access resale certificate
Professionally designed flyers and print materials
Custom listing website
Open house as needed
Informational text message to all scheduled showing agents with detailed showing instructions
Professional photography
Social media marketing blitz
Walkthrough video


